
Landslides
Type of resources
Available actions
Topics
Keywords
Contact for the resource
Provided by
Years
Formats
Representation types
Update frequencies
Service types
Scale
-
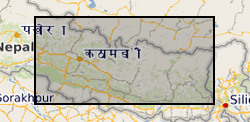
Text file containing the areas (of combined scar, deposition and runnout zones, and estimated scar zones alone) and volumes (for both total and scar areas) of 12,920 Asia Summer Monsoon (ASM) that occurred across central-eastern Nepal in the period 1988 - 2018. Note, landslides were not mapped in the years 2011 and 2012 due to scan line errors in Landsat 7 imagery.
-
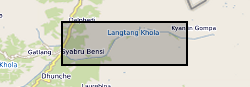
This is a polygon shapefile inventory of 183 coseismic and climate-triggered landslides in the south-western portion of Langtang Valley Nepal. All mapped landslides were those visible in the landscape during the period 2017 – 2018. Landslides were mapped using a combination of field and remote sensing methodologies (see lineage). The inventory includes the landslide locations, perimeters (Length field), areas, types, and whether a given landslide was mapped in the field or remotely. These landslides were mapped for a range of purposes, from conducting landslide susceptibility assessments, to investigating landslide processes and preconditioning.
-
Polygon inventory of 481 landslides mapped along the Arniko Highway, Nepal (NERC Grant NE/L002582/1)
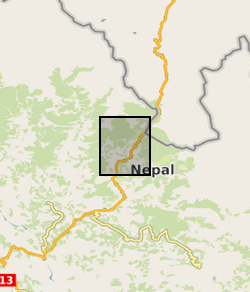
Polygon shapefile including 481 coseismic and climate triggered landslides mapped along the Arniko Highway, Nepal, using a combination of field mapping and remote sensing. All mapped landslides were those visible in the landscape during the period 2017 – 2018. Landslides were mapped using a combination of field and remote sensing methodologies (see lineage). The inventory includes the landslide locations, perimeters (Length field), areas, types (for field mapped landslides), and whether a given landslide was mapped in the field or remotely (source field). These landslides were mapped for a range of purposes, from conducting landslide susceptibility assessments, to investigating landslide processes and preconditioning.
-

The aim of the Landslides Project is to define, describe and catalogue the landslides and mass movements of Great Britain and interpret them in terms of the hazard that they engender so that they may be avoided, or mitigated. A central part of this project is the operation of the National Landslide Database. The National Landslide Database forms the primary record of landslide information in Great Britain. It records information gathered by the Landslide Project and projects elsewhere in the BGS on landslide events and landforms throughout Great Britain. It incorporates information from other databases, including regional landslide databases held within BGS which includes the National Landslide Database created for the DOE in 1994. The database records the name and location of all landslides known to the project and wherever possible also records information on classification, dimensions, physical characteristics, geology, history, causal factors and impacts of each landslide as well as references to other data sources.
-

This dataset provides an assessment of slope instability. Landslide hazard occurs due to particular slope characteristics (such as geology, gradient, sources of water, drainage, man-made constructions) combining to cause the slope to become unstable. Downslope movement of materials, such as a landslide or rockfall may lead to a loss of support and damage to buildings. Complete Great Britain national coverage is available. The storage formats of the data are ESRI Shapefiles and MapInfo but other formats can be supplied. The GeoSure data sets and reports from the British Geological Survey provide information about potential ground movement or subsidence in a helpful and user-friendly format. The reports can help inform planning decisions and indicate causes of subsidence. The methodology is based on 'BGS Geology' (Digital Map) and expert knowledge of the behaviour of the formations so defined.
-
Terrestrial laser scanning data of the slopes above the A83 Rest and Be Thankful collected by a Riegl LMS Z620i instrument in 2016 after Storms Desmond and Frank from 3 positions. These data are scanner centric coordinates which the end-user needs to align and (if required) align into a global coordinate system. Data are in raw format, supplied as .las with scaled intensity included.
-

Numerical models of mass flows and tsunamis that they generated with their entrance in the sea. The mass flows propagate in the Sciara del Fuoco of Stromboli. The mass flows are not real events, but are rather used as a sensitivity analysis to examine tsunamigenic potential of mass flows of landslides and pyroclastic flows of different durations, volumes and coherence. The data was generated with the two fluid version of the Volcflow model. The material includes tsunami height measurements (plotted as well as raw data) for each run recorded by virtual gauges located around the island (map of gauges included), maximum wave height data in the area around the island and at the shores, a video visualisation of the mass flows and resultant tsunami waves, and a figure of the final deposit from each modelled mass flow. The numerical model simulations were carried out by Symeon Makris. The Volcflow code is not included in the submitted material but it is open source and can be downloaded here: https://lmv.uca.fr/volcflow/
-

3D reconstructions and orthophotos of exposures of the 1930 pyroclastic density current on Stromboli. Location 1 is located at UTM W84-33 S_0518638 4295048 and location 2 at UTM W84-33 S_0518956 4294953. The photographs for the models where taken on 28/7/2021 and were converted to the models and orthophotos using structure for motion photogrammetry and the AGISOFT software. The data was collected to aid grain size analysis, by providing a volume change in the outcrop before and after the collection of a physical sample of the material. The data collection was carried by Dr Irene Manzella, Dr Paul Cole and Symeon Makris.
-

This is a polygon Shapefile of 12,920 Asia Summer Monsoon (ASM) - triggered landslides that occurred across central-eastern Nepal in the period 1988 - 2018. This inventory includes the landslide locations, perimeters (Length field), areas and pre-/post- monsoon season satellite image dates used to map each landslide.Note, landslides were not mapped in the years 2011 and 2012 due to scan line errors in Landsat 7 imagery. These landslides were mapped for a range of purposes, from conducting landslide susceptibility assessments, to investigating landslide processes and preconditioning.
-
Information for this layer of the map based index (GeoIndex) is taken from the BGS National Landslide Database (NLD), which holds over 15000 records of landslides and is the definitive source of landslide information for Great Britain (excludes Northern Ireland, Isle of Man and the Channel Islands). Each landslide within the National Landslide Database is identified by a National Landslide Database ID number and a point location, as shown on this map. The National Landslide Database ID number represents an individual survey of a landslide, rather than just the landslide itself. This is because there could be several phases of movement within or extensions to the same landslide, particularly if it is a large and complex one. Subsequent surveys of the same landslide may be recorded in the database with the same National Landslide Database ID number but with a new Survey Number. Other information given for each record include; Landslide name, grid reference and whether the landslide record has been validated by the BGS Landslides Team. The point symbols at the designated location do not reflect the size and shape of the corresponding landslide, but just denote the recorded presence of a landslide within a range of accuracy.