
Induced seismicity
Type of resources
Available actions
Topics
Keywords
Contact for the resource
Provided by
Years
Formats
Representation types
Update frequencies
-
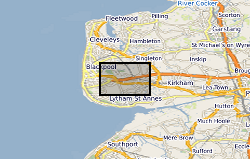
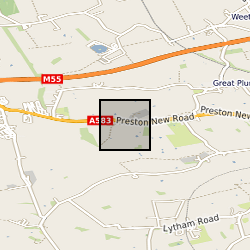
The models are probabilistic inferences of earth structure and earthquake location based around travel times of P and S waves recorded at seismic stations above Preston New Road, Lancashire, UK. For each point in the subsurface, we present many different values of the P- and S-wave velocity which are compatible with the data. Likewise, we present many event locations for each earthquake included in the dataset. These different models represent the posterior probability distribution respectively for the subsurface velocity and earthquake locations.
-

This dataset is a catalogue of elastic stress models of hydraulic fracturing during the 2018 Preston New Road, PNR-1z operations (described in Clarke et al., 2019). This modelling was produced for the publication Kettlety et al. (2020), which studies the physical mechanisms controlling seismicity during hydraulic fracturing. For further details on the modelling approach and context for these data, see Kettlety et al. (2020) and the README file attached here.This is a combined microseismic catalogue of all of the seismic magnitudes recorded for microseismic events recorded during Cuadrilla's Preston New Road hydraulic fracturing operations. 5 magnitude types are given for each event: the downhole measured moment magnitude (Mw); the downhole measured local magnitude (ML); the surface measured ML; the surface measured Mw; and a combined/corrected Mw. This corrected Mw follows the procedure laid out in Kettlety et al. (2021, https://doi.org/10.1785/0220200187) and Baptie et al. (2020, Robust relationships for magnitude conversion of PNR seismicity catalogues. British Geological Survey Open Report, OR/20/042) Functionally, it combines the surface measured Mw and the downhole measured Mw corrected using Equations 4.6 and 4.7 of Baptie et al. (2020). Also included are event origin times, associated injection stages (as described in Clarke et al., 2020, https://doi.org/10.1785/0220190110, and Kettlety et al., 2021), whether this stage was a "minifrac" (just for PNR-1z), the "relative fracture order" (RFO) of that stage, and it's downhole measured location (easting and northing in BNG coordinates, and depth BSL). Downhole measurements Mw and ML were conducting by Schlumberger Ltd. on behalf to the Preston New Road operator Cuadrilla Resources Ldt., and surface ML and Mw were measured by the BGS in Baptie et al., (2020).
-
Homogenised catalogues of microseismicity and pumping data from the PNR-1z and PNR-2 injection wells
Microseismicity catalogues and fluid injection rate data recorded at the Preston New Road (Lancashire, UK) unconventional shale gas site during and after hydraulic fracturing of the PNR-1z and PNR-2 wells. Homogenised seismic catalogues include events recorded by the combined downhole and surface networks operated by the operator (Cuadrilla Resources Ltd.) and the British Geological Survey. Injection rate values are as initially reported by Cuadrilla Resources Ltd. The original datasets were provided by the UK Oil and Gas Authority (OGA).
-
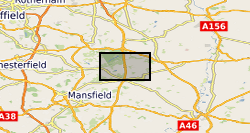
The models are probabilistic inferences of earth structure and earthquake location based around travel times of P and S waves recorded at seismic stations above New Ollerton, Nottinghamshire, UK. For each point in the subsurface, we present many different values of the P- and S-wave velocity which are compatible with the data. Likewise, we present many event locations for each earthquake included in the dataset. These different models represent the posterior probability distribution respectively for the subsurface velocity and earthquake locations.
-

"This data was compiled for the paper "Self-similarity of seismic moment release to volume change scaling for volcanoes: a comparison with injection-induced seismicity", that has been accepted for publication in Geophysical Research Letters. It is a compilation of literature values of volume changes and associated total seismic moment releases for many injection-induced earthquake sequences. It also includes a number of total moment releases and volume changes from volcanic sequences that were calculated for the study from published earthquake catalogues. This work was conducted to examine the response of the shallow crust to volume changes in the two different contexts, make the comparison between them, and discuss why the response is similar or dissimilar. The data consists of two tables. For the fluid injection data the table lists the project name, the approximate dates, the source, the type of operation, and naturally the volume and total seismic moment release. For the volcanotectonic sequences, it lists the name of the eruption/intrusion, the dates, volume change, and moment release. Also included in both tables are the seismic efficiency (functionally the ratio of moment releasee to volume change, see Hallo et al., 2014) and seismogenic index (another measure of the response of the crust to a volume change, see Shapiro et al., 2010). Aki, K. (1965). Maximum likelihood estimate of b in the formula log N = a-bM and its confidence. Bulletin of Earthquake Research Institute of the University of Tokyo, 43, 237–239. Cao, A., & Gao, S. S. (2002). Temporal variation of seismic b -values beneath northeastern Japan island arc Geophysical Research Letters, 29(9), 48-1-48–3. https://doi.org/10.1029/2001gl013775 Hallo, M., Oprsal, I., Eisner, L., & Ali, M. Y. (2014). Prediction of magnitude of the largest potentially induced seismic event. Journal of Seismology, 18(3), 421–431. https://doi.org/10.1007/s10950-014-9417-4 Shapiro, S. A., Dinske, C., Langenbruch, C., & Wenzel, F. (2010). Seismogenic index and magnitude probability of earthquakes induced during reservoir fluid stimulations. Leading Edge, 29(3), 304–309. https://doi.org/10.1190/1.3353727 "
-

This dataset contains earthquake catalogs from induced seismicity cases in western Texas and northern Oklahoma/Kansas, and the results of earthquake magnitude forecasting methods (using Extreme Value Theory) applied to these datasets (Verdon and Eisner, 2024). The catalogs archived here were curated from regional earthquake datasets: for Oklahoma/Kansas the original data source was Park et al. (2022, DOI 10.1785/0320220020) and for Texas the original source was TexNet (https://catalog.texnet.beg.utexas.edu). Verdon and Eisner (2024) curated subsets of this data (drawn from within 20 x 20 km2 "blocks") in order to apply and test their forecasting methods on localised event catalogs. In this dataset we provide the localised catalogs, and the results of the forecasting models (tracking forecasted earthquake magnitudes over time in comparison with the observed evolution of events). The input data and forecasting results are provided in Matlab format structures (.mat). Matlab scripts and functions (.m files) are also provided to read the data and perform the analyses that are presented in Verdon and Eisner (2024). A README text file is provided that details the content of the Matlab structures. Reference: Verdon, J.P., and L. Eisner, 2024. An empirically constrained forecasting strategy for induced earthquake magnitudes using extreme value theory: Seismological Research Letters 95, 3278-3294. DOI: 10.1785/0220240061
-

This data repository contains the raw waveforms of seven hydraulic fracturing-induced seismic events, together with their rupture directivity analysis. The entire data is consolidated in one .mat file per seismic event (which can be read with Matlab and Octave). A detailed description of the .mat files, and a Matlab script to import and visualise the seismic data and rupture directivity analysis of each event, is also included in this repository. The passive seismic dataset was collected in a shale gas field near Fox Creek, Alberta, Canada, during a multi-stage hydraulic fracturing stimulation that induced shallow earthquakes (less than 5 km deep) of magnitudes up to 3.2. This area has experienced in recent years multiple cases on induced seismicity associated with oil and gas operations, including hydraulic fracturing and wastewater disposal, of magnitudes above 4.0 in some cases. The full passive seismic dataset was collected between October and November 2016 and made open source through a GitHub repository (https://github.com/ToC2ME). To determine the rupture directivity of each induced seismic event, we use the Empirical Green's Functions (EGF) method to first obtain apparent source time functions (ASTF), and then measure the rupture time at each seismic station. We then invert the rupture directivity of each seismic event based on the azimuthal variation of the measured rupture times at each seismic station. Observations of rupture directivity (the direction of propagation of the earthquake rupture) can provide important information as to the nature of the interactions between injection-induced pressure increases and earthquake nucleation. Measurement of rupture directivity could therefore have important implications for induced seismicity hazard management. The rupture directivity analysis of these hydraulic fracturing-induced seismic events was led and coordinated by Dr. James Verdon and Dr. Germán Rodríguez at the School of Earth Sciences, University of Bristol.
-

This data set contains seismic source parameters (magnitudes, corner frequencies, stress drops and their associated uncertainty) for 94 microseismic events linked to fault reactivation during hydro-fracturing operations in the Horn River Basin (British Columbia). The data presented here were derived from proprietary third party seismic data recorded on 2 arrays of 35 - 15 Hz GEO-OMNI-2400 borehole geophones each. These data were first reported in Adam G Klinger, Maximilian J Werner, Stress drops of hydraulic fracturing induced microseismicity in the Horn River basin: challenges at high frequencies recorded by borehole geophones, Geophysical Journal International, Volume 228, Issue 3, March 2022, Pages 2018–2037, https://doi.org/10.1093/gji/ggab458