
Geoscientific information
Type of resources
Available actions
Topics
Keywords
Contact for the resource
Provided by
Years
Formats
Representation types
Update frequencies
status
Scale
Resolution
-
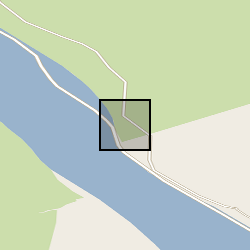
A digital elevation model of the bed of Rutford Ice Stream, Antarctica, derived from radio-echo sounding data. The data cover an 18 x 40 km area immediately upstream of the grounding line of the ice stream. This area is of particular interest because repeated seismic surveys have shown that rapid erosion and deposition of subglacial sediments has taken place. The bed topography shows a range of different subglacial landforms including mega-scale glacial lineations, drumlins and hummocks. This dataset will form a baseline survey which, when compared to future surveys, should reveal how active subglacial landscapes change over time. The dataset comprises observed ice thickness data, an interpolated bed elevation grid, observed surface elevation data and a surface elevation grid.
-
The data set contains values of basal slipperiness (C) and the rate factor (A) for the whole of the Antarctic Ice Sheet. The slipperiness was estimated through model inversion from measurements of surface velocities (1) and ice thickness (2) using the ice-flow model Ua (3). The ice was assumed to deform according to Glen's flow law with a stress exponent n=3. Basal sliding was assumed to follow Weertman sliding law with m=3, with u_b = C tau^m, where u_b is the basal sliding velocity and tau the (tangential) basal traction.
-
A netcdf-formatted file containing the original binned data (described in Shore et al [2017]), in their state before they were subjected to EOF analysis. These have had additional processing applied to the SuperMAG data (publically available at http://supermag.jhuapl.edu/) in the form of sampling them to the centroid of the bins, thus they are worth providing here despite the large file size (approximately 12GB). To conserve file space, we have removed empty bins, thus the temporal and spatial basis for these data are provided for each filled bin element. Please note that the binned data had not had the temporal mean values (described in Shore et al [2017], and available in the Supporting Information) removed when they were stored in this netcdf file. The file contains 144 (monthly) sets of 8 variables. These variables are named: 1: filled_bin_data_YYYYMM_r 2: filled_bin_data_YYYYMM_theta 3: filled_bin_data_YYYYMM_phi Variables 1 to 3 contain the nanoTesla vales of the binned data for each of the three magnetic field components in the Quasi-Dipole frame. 4: filled_bin_contrib_stations_YYYYMM The three-letter SuperMAG acronym of the station which contributed to each 5-minute mean data point. 5: filled_bin_colats_YYYYMM 6: filled_bin_longs_YYYYMM Variables 5 and 6 are the co-latitude and longitude coordinates of each filled bin element. 7: filled_bin_times_YYYYMM The 5-minute-mean epoch of each filled bin element, with columns in the order: year, month, day, hour, minute, second). 8: filled_bin_indices_YYYYMM A set of fiducial values describing how the sparse elements of the 1D vector of filled bin values relate to the fiducials of the (transposed!) EOF prediction a 2D matrix product of the spatial and temporal eigenvectors with values in every bin. An example of the usage of these data is given in the MATLAB program Shore-ms01.m, provided in the Supporting Information of Shore et al [2017]. ***** PLEASE BE ADVISED TO USE VERSION 2.0 DATA ***** The VERSION 2.0 data set has been corrected for a bug which led to the bins which span the local midnight meridian having fewer samples than they should. The data density in these bins is now in-line with the rest of the polar coverage. Apart from that change, the original and updated data sets are the same.
-
A netcdf-formatted file containing the original binned data (described in Shore et al [2017]), in their state before they were subjected to EOF analysis. These have had additional processing applied to the SuperMAG data (publically available at http://supermag.jhuapl.edu/) in the form of sampling them to the centroid of the bins, thus they are worth providing here despite the large file size (approximately 12GB). To conserve file space, we have removed empty bins, thus the temporal and spatial basis for these data are provided for each filled bin element. Please note that the binned data had not had the temporal mean values (described in Shore et al [2017], and available in the Supporting Information) removed when they were stored in this netcdf file. The file contains 144 (monthly) sets of 8 variables. These variables are named: 1: filled_bin_data_YYYYMM_r 2: filled_bin_data_YYYYMM_theta 3: filled_bin_data_YYYYMM_phi Variables 1 to 3 contain the nanoTesla vales of the binned data for each of the three magnetic field components in the Quasi-Dipole frame. 4: filled_bin_contrib_stations_YYYYMM The three-letter SuperMAG acronym of the station which contributed to each 5-minute mean data point. 5: filled_bin_colats_YYYYMM 6: filled_bin_longs_YYYYMM Variables 5 and 6 are the co-latitude and longitude coordinates of each filled bin element. 7: filled_bin_times_YYYYMM The 5-minute-mean epoch of each filled bin element, with columns in the order: year, month, day, hour, minute, second). 8: filled_bin_indices_YYYYMM A set of fiducial values describing how the sparse elements of the 1D vector of filled bin values relate to the fiducials of the (transposed!) EOF prediction a 2D matrix product of the spatial and temporal eigenvectors with values in every bin. An example of the usage of these data is given in the MATLAB program Shore-ms01.m, provided in the Supporting Information of Shore et al [2017]. ***** PLEASE BE ADVISED TO USE VERSION 2.0 DATA ***** The VERSION 2.0 data set (see 'Related Data Set Metadata' link below) has been corrected for a bug which led to the bins which span the local midnight meridian having fewer samples than they should. The data density in these bins is now in-line with the rest of the polar coverage. Apart from that change, the original and updated data sets are the same.
-
The dataset comprises multi-proxy analyses of a sediment core (LC7) extracted from Blaso, a large epishelf lake on the margin of 79 degree N Ice Shelf, NW Greenland in July-August 2017. The data are used to constrain ice shelf dynamics over the last 8500 calibrated years before present (cal. years B.P., where present is A.D. 1950). A 2 m-long sediment core was recovered with a UWITEC KOL 'Kolbenlot' percussion piston corer to a total sediment depth of 3.74 m. Core LC7: 87 m water depth; 79.589 degrees N, 22.494 degrees E. Sedimentological data for the LC7 sediment record consists of physical properties (magnetic susceptibility, wet bulk density) and foraminifera data. This project was funded by the Natural Environment Research Council (NERC) through Standard Grant NE/N011228/1. We thank the Alfred Wegner Institute, and particularly Angelika Humbert and Hicham Rafiq, for their significant logistic support through the iGRIFF project. Additional support was provided from Station Nord (Jorgen Skafte), Nordland Air, Air Greenland and the Joint Arctic Command. Naalakkersuisut, Government of Greenland, provided Scientific Survey (VU-00121) and Export (046/2017) licences for this work.
-
The data presented in the Table 1 are U-Th chronology results of Siberian and Mongolian speleothems. This data is a basis for a scientific paper of Vaks, A. et al. (2013) "Speleothems Reveal 500,000-Year History of Siberian Permafrost." Science 340 (6129): 183-186. The table shows the ages of 111 layers of 36 speleothems taken from the six caves of Siberia and Mongolia. Vadose speleothems grow in caves of unsaturated zone when atmospheric water infiltrates into the caves from the surface. Therefore these speleothems cannot grow in permafrost, as well as in dry desert conditions. Therefore in Siberia the periods of speleothem growth show intervals during which the Siberian permafrost thawed and became discontinuous or absent. In Mongolian Gobi Desert the speleothem deposition periods show when the desert was both humid than present and warm enough to enable water infiltration into the caves. The data presented in tables 2 and 3 are OxCal-4.1 modeling results of the Table 1 chronology data for the Holocene (Table 2) and Marine Isotopic Stage (MIS) 5.5 (Table 3). The tables show exact durations of Holocene and MIS-5.5 permafrost thawing periods in Botovskaya and Okhotnichya Caves.
-
2 papers and supplementary information produced from NERC Grant NE/I006427/1. Lear, C. H., H. K. Coxall, G. L. Foster, D. J. Lunt, E. M. Mawbey, Y. Rosenthal, S. M. Sosdian, E. Thomas, and P. A. Wilson (2015), Neogene ice volume and ocean temperatures: Insights from infaunal foraminiferal Mg/Ca paleothermometry, Paleoceanography, 30, 1437–1454, doi:10.1002/2015PA002833. Elaine M. Mawbey, Caroline H. Lear; Carbon cycle feedbacks during the Oligocene-Miocene transient glaciation. Geology ; 41 (9): 963–966. doi: https://doi.org/10.1130/G34422.1
-
Controlled CO2 release experiments and studies of natural CO2 seeps have been undertaken at sites across the globe for CCS applications. The scientific motivation, experimental design, baseline assessment and CO2 detection and monitoring equipment deployed vary significantly between these study sites, addressing questions including impacts on benthic communities, testing of novel monitoring technologies, quantifying seep formation/style and determining CO2 flux rates. A review and synthesis of these sites studied for CCS will provide valuable information to: i. Enable the design of effective monitoring and survey strategies ii. Identify realistic site-specific environmental and ecosystem impact scenarios iii. Rationalise regulatory definitions with what is scientifically likely or achievable iv. Guide novel future scientific studies at natural or artificial release sites. Two global databases were constructed in Spring 2013, informed by a wide literature review and, where appropriate, contact with the research project leader. i. Artificial CO2 release sites ii. Natural CO2 seeps studied for CCS purposes The location and select information from each of these datasets are intended to be displayed as separate GoogleMap files which can be embedded in the QICS or UKCCSRC web server. These databases are not expected to be complete. Information should be added as more publications or become available or more case studies emerge or are set up. To facilitate this process, a contact email should be included beneath the map to allow viewers to recommend new or overlooked study sites for the dataset. Grant number: UKCCSRC-C1-31. These data are currently restricted.
-

This map is part of the open-loop ground source heat pump screening tool and shows where suitable subsurface conditions exist in England and Wales for open loop GSHP installations of >100kW heating/cooling output .
-
Radiocarbon measurements on planktic and benthic foraminifera from sediment cores in the North Atlantic: Ocean Drilling Program (ODP) 983, SU90-44, MD04-2829, MD01-2461, and EW9302-2JPC Site 983 is located on the Bjorn Drift in approximately 1650 m water depth on the eastern flank of the Reykjanes Ridge. Hole 983A Position: 60°24.200'N, 23°38.437'W. Sediment core SU90-44 collected from the north-eastern Atlantic basin, near the top of a small abyssal hill, southeast of the Rockall plateau, 50°01'N, 17°06'W, 4279 m. Sediment core MD04-2829 collected from Rosemary Bank in the Northern Rockall Trough 58º 56.93’ N; 09º 34.30’ W; 1743 m water depth. Sediment core MD01-2461 was collected from the north-western flank of the Porcupine Seabight approximately 550 km to the southwest, 51°45’N, 12°55’W; 1153 m water depth, recovered in 2001. Core EW9302-2JPC recovered from the Rockall Plateau and East Flank of Reykjanes Ridge from the Flemish Cap in the south- eastern Labrador Sea, 48°47.70′N, 45°05.09′W, taken at water depth 1251m.