 NERC Data Catalogue Service
GPS
Type of resources
Available actions
Topics
Keywords
Contact for the resource
Provided by
Years
Formats
Representation types
Update frequencies
status
Resolution
-
Continuous GPS measurements between 2002 and 2008 were made at a number of stations across the Aegean to monitor tectonic movement across the Eastern Mediterranean by the UK's Centre for the Observation and Modelling of Earthquakes, Volcanoes and Tectonics (COMET). These data are made available in the RINEX (Receiver-INdependent data EXchange) format, version 2.10 or more recent, with Hatanaka compaction and UNIX compression applied. These data are available to all registered users under the UK Government Open Data licence. This was part of an ongoing collection published in yearly datasets.
-
A hand-held Garmin GPS was used to map vegetation patches on Leonie and Anchorage Island in February 2007. Discrete patches of vegetation were walked round, and the recorded track saved. The aim of the data collection was to provide some ground truthing data for vegetation NVDI (Normalized Difference Vegetation Index) ratios calculated from satellite data. Funding: UK Natural Environment Research Council (core funding to the British Antarctic Survey).
-
Integrated water vapour (IWV) data from the Met Office's GPS instrument located at the Natural Environment Research Council (NERC) Mesosphere-Stratosphere-Troposphere (MST) Radar Facility, Capel Dewi, near Aberystwyth in West Wales. These data are restricted (please use the apply for access link) and made available under the NERC-Met Office agreement.
-
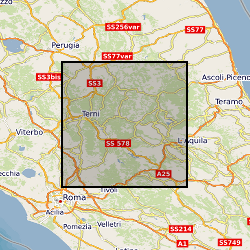
Single-frequency Global Navigation Satellite System (GNSS) observation data as daily files in compressed Hatanaka format. Near-field deployment of single-frequency receivers along the surface rupture of the 2016 Amatrice & Norcia earthquakes (Central Italy)
-
This dataset collection holds a repeatable kinematic dataset taken from Global Navigation Satellite Systems (GNSS) stations on moving platforms at the Snowdon Mountain Railway (SMR). The datasets include profiles of 950m of the lower atmosphere over a 50 day period in 2011. There are three different locations used in the dataset as it was mounted on a train of the Snowdon Mountain Railway (SNTR) as it travelled up and down the mountain, with two static reference stations at the base of the railway at Llanberis (SNLB) and at the summit (SNSU). Three instruments were used to collect the data including; Paroscientific 745, Paroscientific Met 4 and Leica GS10 GNSS receivers. Respectively measuring pressure, pressure/temperature, dual frequency GPS and GLONASS code and carrier phase satellite to receiver measurements.
-
This dataset captures foraging locations from high resolution GPS tracking and reproductive success of 346 wandering albatrosses (Diomedea exulans) breeding on Possession Island, Crozet Islands archipelago, Southern Indian Ocean from 2010 to 2020. GPS locations are available at fix frequencies from 1 to 15 minutes. Breeding success data are accompanied by personality ('boldness') values and sex of each individual. GPS data were used to study the effect of climate variation, and its interaction with personality, on behaviour and reproductive success. This research was supported by NERC standard grant NE/V015036/1.
-

This data set contains daily position solutions for GPS stations deployed on Corbetti and Aluto volcano, Ethiopia. The results for Aluto were originally published in "Seasonal patterns of seismicity and deformation at the Alutu geothermal reservoir, Ethiopia, induced by hydrological loading", Birhanu et. al. (2018). Corbetti results were partially published in "Sustained Uplift at a Continental Rift Caldera", Lloyd et al. (2018).
-
This is a collection of GPS data from dual-frequency GPS units deployed on the Filchner-Ronne Ice Shelf and adjoining ice streams. Filenames contain ice stream code and, in some cases, where the ice stream code is followed by a plus or minus sign, the approximate distance in kilometres upstream from the ice stream's grounding line, although in other cases the number is arbitrary. The naming convention has been preserved for legacy reasons. The ice streams are Evans (E & XX), Rutford (R), Institute (IIS), Talutis (T & TT) and Foundation (H) ice streams. Each GPS unit's data are given in a netCDF4_classic file containing 4 columns: "Date number", as the number of days from January 0, 0000 in the proleptic ISO calendar; "Latitude" & "Longitude", both in decimal degrees in the WGS 1984 EPSG:4326 co-ordinate system; "height", in metres above the reference ellipsoid. The data have been collated from daily files, processed using the Bernese 5.0 software, using precise point positioning at intervals of 30 seconds. Note that data have not been corrected for inverse barometer or ocean tide loading effects. These data were collected as part of a systemic campaign to look for modulation in ice flow through ocean tidal forcing. The vertical tidal motion of floating ice shelves generates stresses which cause a change in horizontal ice velocity at periods of hours to years. These signals can travel far upstream of ice stream grounding lines and often exhibit a change in frequency from the astronomical tides that generate them. As such, they can act as a natural experiment with which we can learn about ice rheology and subglacial processes.
-
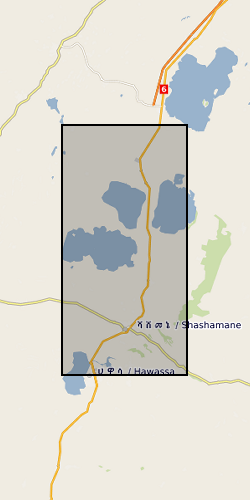
The RiftVolc GPS network was comprised of a total of 10 continuously recording stations deployed on Aluto and Corbetti Volcanoes between 2012 to present. At least 9 stations were recording data simultaneously except in 2012, 2016 and 2017 where 1, 8 and 5 stations were in operation respectively. Full details on station location and operation periods are provided in the attached README file.
-
From May 2009 to May 2013, seven dual-frequency GPS receivers were deployed along a 120 km-long transect in the south-west of the Greenland Ice Sheet. Two additional dual-frequency GPS receivers were deployed perpendicular to longitudinal ice flow at ~14 km inland: one 5 km distant from June 2011 to May 2013, and another 2.5 km distance from May 2012 to May 2013. Each receiver recorded position observations every 10 seconds or 30 seconds (depending on configuration), enabling resolution of horizontal and vertical ice motion. Sites were powered by solar panels and operated 24 hours a day during summer but shut down in the autumn. Absolute ice displacements at each site were obtained for each summer and winter period in the absence of continuous measurements. Position measurements were kinematically corrected relative to an off-ice base station using TRACK (Chen, 1999). Daily velocities were then obtained by differencing across 24-hour periods, whilst continuous velocities were obtained through application of a sliding 6-hour differencing window. At each GPS site we also measured (1) the near-surface air temperature every 15 minutes year-round, (2) net seasonal ablation using ablation stakes, and (3) at several selected sites melt rates using sonic ranging sensors. Funded by NERC, the Carnegie Trust for the Universities of Scotland and The University of Edinburgh. Relevant grants: NE/F021399/1, NE/H024964/1 Studentships: NE/I52830X/1, NE/J500021/1, NE/H526794/1