
Citable Data
Type of resources
Available actions
Topics
Keywords
Contact for the resource
Provided by
Years
Formats
Representation types
Update frequencies
Scale
Resolution
-

3D simulation results and animations of copper leaching, transport and deposition in sedimentary basins during the postrift stage according to Scenario 1 in Bahlali et al. (2025). Models are built using surface-based modelling approach (doi:10.1007/s11004-018-9764-8). Flow simulations are run with IC-FERST (multifluids.github.io), using unstructured tetrahedral meshes that adapt to geological heterogeneity and flow behaviour throughout the simulation to improve simulation quality and performance. Folder structure: Simulation: Contains 3D unstructured adaptive mesh output in .vtu format (openable with ParaView, www.paraview.org). Time interval between successive outputs is 50,000 years. Animations: Includes Supplementary Videos (SV) visualising - SV2: 3D view of salt transport over the postrift period (salinity in kg/kg) - SV3: Brine circulation and copper deposition over the postrift period - SV4: 3D view of Cu transport (rock Cu concentration in kg/kg) - SV5: 3D view of Cu transport (groundwater Cu concentration in kg/kg) - SV6: Top view of Cu mineralisation at the redox boundary (rock Cu concentration in kg/kg)
-

The data comprise P-wave velocity and attenuation (1/Q) measurements of ice-bearing sand packs across ice saturation levels during melting, from frozen to fully melted conditions. Using an acoustic pulse tube, measurements were recorded in the sonic frequency range (1-20 kHz, centred at 10 kHz) under 2.5 MPa effective pressure with atmospheric pore pressure. Data were collected in the Pulse Tube Laboratories at the National Oceanography Centre (NOC), Southampton, between March and July 2023, funded by the Natural Environment Research Council (NERC Grant NE/J020753/1), and primarily collected and analysed by Hanif Sutiyoso (University of Southampton). The experiment aimed to fill gaps in sonic frequency measurements of ice-bearing sediment/permafrost, particularly during melting/thawing, providing a spectrum of ice/water saturation rather than a single value. This dataset is valuable for researchers analysing thawing/melting permafrost, and is directly comparable to sonic well-logging field data due to its frequency range, and potential for monitoring application. The work regarding this dataset can be found at: https://doi.org/10.22541/essoar.172854543.39791425/v1. The method involved measuring the time series of signal amplitude from two ice-bearing sand samples inside a 4.5 m water-filled acoustic pulse tube, which allows plane wave propagation in the sediment-jacketed samples. Time-domain data were transformed into the frequency domain using the Fast Fourier Transform (FFT) and deconvolved with the chirp source signal to obtain the impulse response. Nonlinear inversion was used to minimize an objective function derived from initial time-domain estimates, determining the sample's complex velocity and attenuation (1/Q).
-

This dataset is made up of two parts. 1. Stress field orientations which were interpreted as part of the Stress Histories and Reservoir Properties project (SHARP Storage). SHARP Storage is a research project funded under the ERA-NET ACT program, Project No 327342. http://www.act-ccs.eu/. 2. Legacy stress field data which has been collected by various BGS projects, or from third party reports.
-
Wind, sediment transport and surface/saltation data collected at Huab River Valley during a field campaign in September 2019 to investigate saltation on gravel and sand surfaces. Surface/saltation data: This is terrestrial laser scanned (TLS) data collected over sand and gravel surfaces during multiple days when saltation was active, on a surface approximately 8 m from the TLS, perpendicular to the wind direction. The data is raw point cloud format in text columns of x, y and z coordinate data. Files are named *_^_scan& where * is the date that the data was collected in yymmdd format, ^ is surface type (sand or gravel) and & is the scan number. Each data set uses the same coordinate system. Data can be viewed in any spatial software. Wind and sediment data were collected from a fixed point on each surface, directly downwind of the TLS data. The data is in csv file format with column titles and can be viewed in any text or database software. Data include hot wire measurements at different heights, Wenglor counts, sensit counts and 3D sonic measurements on some days. Sonic data is at 10 Hz, hotwire data at 10 second intervals, transport data is given within both datasets.
-
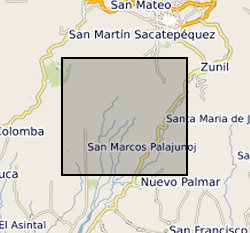
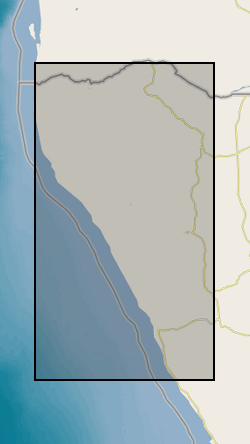
Continuous seismic waveforms from a network deployed at Santiaguito volcano between 2014 and 2015. Data are collected on broadband and short-period seismometers to record all volcanic activity for the period. Recorded data includes explosions, rockfalls and regional earthquakes.
-
Concentrations of gaseous and aqueous fixed nitrogen products and isotopic measurements of aqueous nitrite and nitrate in spark discharge experiments. Spark experiments were conducted at the University of St Andrews in the St Andrews Isotope Geochemistry Lab (StAIG) between November 2020 and February 2022. Analysis of gaseous products was carried out with a quadrupole mass spectrometer (Hiden Analytical ExQ Quantitative Gas Analyser) in St Andrews. Measurement of concentrations of aqueous nitrite and nitrate and their isotopic composition were carried out for one part of the samples in St Andrews and for the other part at Brown University, Rhode Island, USA. The data was collected to investigate the efficiency of nitrogen fixation by lightning in different gas compositions, resembling the atmospheres of modern and early Earth. The isotope data was used to determine the role of lightning in the delivery of nutrients to the earliest ecosystems on Earth by comparing our results to measurements of sedimentary rock samples from the Archean. The experimental set up was built by Patrick Barth and Eva E. Stüeken, the experiments were conducted by Patrick Barth, Lukas Rossmanith, and Yuqian Peng, the analysis conducted by Patrick Barth, Lukas Rossmanith, Yuqian Peng, and Wendell Walters with support from Mark Claire, and the data was analysed by Patrick Barth, Eva E. Stüeken, Christiane Helling, and Wendell Walters. This dataset includes all data that is reliable and was used in the accompanying publication.
-

The BGS PSA dataset provides insurers and homeowners access to a better understanding of the shrink-swell hazard at both the individual property and/or postcode level for Great Britain. It builds upon the GeoSure shrink-swell data by mapping the hazard to the individual building polygon and considering the other susceptibility factors of building type, foundation depth, and drainage and tree proximity. The user receives GIS building polygons with an overall susceptibility to subsidence score between 1-100. Scores are also classified from non-plastic to very high. Each building polygon is also scored from 1-10 for each subsidence factor (geology, foundation, drainage, building type, building storey and tree proximity). Postcode data is also available as a table and shapefiles showing the ‘average’ PSA score for all buildings within the postcode. The identification of shrink-swell related subsidence prone areas, alongside the inclusion of potential sources to exacerbate this phenomena, can better inform insurers and homeowners and form the basis to make decisions concerning prevention and remediation. The product enhances geological information obtained from GIP and GeoSure via the inclusion of the crucial shrink-swell susceptibility factors (proximity to trees and foundation depth). This therefore allows the derivation of a risk element for the housing stock at Building level, which is then generalised to Postcode level.
-

This dataset includes numerical simulation data of bottom heated convection in a rotating spherical shell. These numerical models are used to investigate the dynamics of convection in planetary cores. The simulations are performed over a range of thermal forcing and rotation rate [1-3] to study the various dynamical regimes of rotating convection. The dataset includes the simulation states to reproduce the simulations, time-series output of relevant variables from the simulations apart from post-processed diagnostic quantities. Due to large volume of the simulation state files only the initial, final and time averaged files are stored in the dataset in NETCDF format. The simulation diagnostics are provided in text, which includes time series, spatial and temporal averages of various diagnostic quantities (e.g. kinetic energy of convection) and forces to assess the underlying dynamics and heat transfer behaviour. The simulations have been performed using the Leeds Spherical Dynamo code [4], using ARC2, ARC3 and ARC4 HPC system in University of Leeds and the ARCHER and ARCHER2 HPC system. Refs: [1] https://doi.org/10.1017/jfm.2017.539 [2] https://doi.org/10.1017/jfm.2020.67 [3] https://doi.org/10.48550/arXiv.2410.03369 [4] https://github.com/Leeds-Spherical-Dynamo/leeds-spherical-dynamo
-

This dataset comprises broadband seismic data from the Askja Caldera, Iceland, which consists of ~12 months of continuous recording from August 2023-August 2024. A total of 23 Guralp 6TD and Certimus seismometers were deployed in and around the ~8km diameter caldera, with sampling rates set to 100sps. Each seismometer was buried ~30cm below the surface, and attached to a power supply consisting of 3 100Amp-hour batteries and 100 W solar panels mounted on a wooden frame. The batteries were placed in a box that sat on the supports of the solar panel frame to act as ballast, and wrapped in a plastic sheet. A Gps unit was mounted on the solar panel frame. Access to most stations is by foot, and installation was undertaken either by carrying the equipment on foot or by helicopter. The dataset provided is in standard miniseed format, and has an accompanying dataless file for each instrument type in xml format. The miniseed data is archived in day files under the directories "2023" and "2024", while the xml file is located in the directory "dataless". The data is of good quality, with both local earthquakes and teleseisms easily detected. The data were collected for the purposes of tracking microseismic activity associated with the recent reinflation event at Aska, and to help facilitate seismic imaging beneath the caldera using both body and surface wave tomography. The data may be of use to other scientists with an interest in earthquake seismology, imaging, and characterisation of geothermal areas near active volcanoes. The data were collected by the University of Iceland and University of Cambridge, both of who are responsible for interpretation of the data. The archive is complete as it currently stands. The data were converted into miniseed using a standard format that is consistent with archives stored at the IRIS DMC.
-
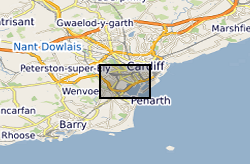
Groundwater temperature data from a shallow urban aquifer in Cardiff, Wales, UK between 2014-2018. Monitoring was undertaken as part of the ‘Cardiff Urban Geo-Observatory’ project . Boreholes are located within the urban area of the City of Cardiff, Wales, UK. The majority of temperature sensors were installed within boreholes that monitor a shallow Quaternary aged sand and gravel aquifer, however the made ground and the Triassic Mercia Mudstone also represented. Temperature sensors installed in 53 boreholes, between depths of 1.5m and 12- m below ground, with measurements every 30 minutes. The dataset comprises of just over 3.5 million temperature measurements. Monitoring was undertaken by the British Geological Survey and was designed to address knowledge gaps of subsurface urban heat island and it use for heat recovery and storage. Metadata Report http://nora.nerc.ac.uk/id/eprint/525332/