
Aquifers
Type of resources
Available actions
Topics
Keywords
Contact for the resource
Provided by
Years
Formats
Representation types
Update frequencies
Service types
Scale
Resolution
-
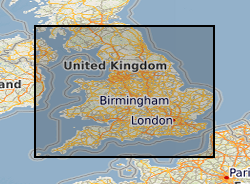
Joint BGS/Environment Agency dataset of aquifer designations for England and Wales at 1:50 000. The dataset identifies different types of aquifer - underground layers of water-bearing permeable rock or drift deposits from which groundwater can be extracted. These designations reflect the importance of aquifers in terms of groundwater as a resource (drinking water supply) but also their role in supporting surface water flows and wetland ecosystems. The maps are split into two different type of aquifer designation: superficial - permeable unconsolidated (loose) deposits (for example, sands and gravels), and bedrock - solid permeable formations e.g. sandstone, chalk and limestone.
-

This dataset classifies bedrock and superficial geologic units according to their aquifer designation - Principal Aquifers, Secondary Aquifers (Secondary A, Secondary B, and Secondary undifferentiated), and Unproductive Strata. The Environment Agency (EA) and Natural Resources Wales (NRW) help to protect groundwater by identifying different types of aquifers ‐ underground layers of water‐bearing, permeable rock or drift deposits from which groundwater can be extracted. The groundwater protection policies for the EA and Natural Resources Wales use aquifer designations that are consistent with the Water Framework Directive. These designations reflect the importance of aquifers in terms of groundwater as a resource (such as a drinking water supply) but also their role in supporting surface water flows and wetland ecosystems. The aquifer designation dataset is jointly owned by the British Geological Survey (BGS) and the Environment Agency (EA). The dataset covers geologic units mapped in England and is derived from BGS Geology 50k (DiGMapGB-50).
-

Card index of hydrogeological references, including "Whitaker" bibliography and material up to 1950s.
-

Collection of reports and general hydrogeological/geological information held in box files by country, almost exclusely by Jeff Davies.
-
(I) Handpump Vibration Data For each handpump, data is organized in one CSV file per day. These files are grouped together over batches, where each batch approximately corresponds to three months. (II) Borehole Water Level Data Water level data at the borehole of each handpump is recorded in one CSV file per handpump. Both uncompensated (raw) and compensated (with respect to atmospheric pressure) data are available. (III) Data Time Logs A separate Excel file lists the locations of the monitoring sites and the time logs corresponding to both (I) and (II) per handpump. References: [1] P. Thomson, R. Hope, and T. Foster, “GSM-enabled remote monitoring of rural handpumps: a proof-of-concept study,” Journal of Hydroinformatics, vol. 14, no. 4, pp. 829–839, 05 2012. [Online]. Available: https://doi.org/10.2166/hydro.2012.183 [2] F. Colchester, “Smart handpumps: a preliminary data analysis,” IET Conference Proceedings, pp. 7–7(1). [Online]. Available: https://digital-library.theiet.org/content/conferences/10.1049/cp.2014.0767 [3] H. Greeff, A. Manandhar, P. Thomson, R. Hope, and D. A. Clifton, “Distributed inference condition monitoring system for rural infrastructure in the developing world,” IEEE Sensors Journal, vol. 19, no. 5, pp.1820–1828, March 2019. [4] F. E. Colchester, H. G. Marais, P. Thomson, R. Hope, and D. A. Clifton, “Accidental infrastructure for groundwater monitoring in africa,” Environmental Modelling Software, vol. 91, pp. 241 – 250, 2017. [Online]. Available:http://www.sciencedirect.com/science/article/pii/S1364815216308325 [5] A. Manandhar, H. Greeff, P. Thomson, R. Hope, and D. A. Clifton, “Shallow Aquifer Monitoring Using Handpump Vibration Data,” In-review, 2019.
-

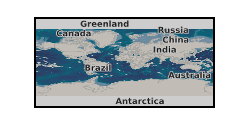
This is a series of maps, in GIS shapefile format, for each of 48 countries in Africa, that show hydrogeology (aquifer type and productivity) and geology (with particular relevance to hydrogeology) at 1:5 million scale. The maps have two hydrogeological themes: -geology with geological categories that reflect significant hydrogeological units; and -hydrogeology, combining classifications of aquifer type and productivity. The maps were produced as part of the Africa Groundwater Atlas project.
-
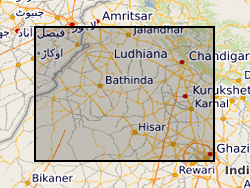
Matlab m-file code to generate a probabilistic model of aquifer-body occurrence in the subsurface of the Indo-Gangetic foreland basin, northwestern India. The accompanying ArcGIS ASCII matrix files give aquifer-body percentages in successive 10 m depth slices for use within the model. File xxx_01.txt is for depths 0-10 m, file xxx_02.txt for depths 10-20 m, etc.
-

This map layer shows the classification of bedrock, as mapped at 1:250 000 scale, into aquifer categories. This classification was initially undertaken to support groundwater assessments undertaken for the Water Framework Directive (2000/60/EC). The classification was produced on behalf of Northern Ireland Environment Agency (NIEA) (DoE, Northern Ireland) and is the standard classification currently used for assessing activities which may impact on groundwater resources. The classification comprises six categories of bedrock aquifer, based upon relative resource productivity and flow type. Bedrock aquifer classification categories and overview description Bedrock High potential productivity fracture flow: Bh (f): High to moderate yields probable, however dependence on fracture flow makes poorer yields possible. Generally includes element of regional flow (kms). High potential productivity fracture/intergranular flow: Bh (l to f): High to moderate yields probable, however part dependence on fracture flow makes poorer yields possible. Dual porosity. Generally includes element of regional flow. High potential productivity fracture flow with karstic element: Bh (f to k): High to moderate yields probable, however dependence on fracture flow makes poorer yields possible. Evidence of karstic flow. Generally includes element of regional flow. Moderate potential productivity fracture flow: Bm (f): High to moderate yields possible in places however dependence on fracture flow makes poorer yields possible. Potential element of regional flow, but local flow significant. Limited potential productivity fracture flow: Bl (f): Moderate yields unusual. Low yields more common. Regional flow limited. Mainly shallow, local flow. Poor potential productivity fracture flow: Bp (f): Small supplies may be possible but strata rarely exploited. Negligible regional flow. Limited local flow The classification is intended to represent general regional differences in resource potential and dominant groundwater flow mechanisms in bedrock units as mapped at 1:250 000 scale across Northern Ireland. The classification is not intended to identify, for bedrock at a specific site location, what the aquifer properties are or what the yield will be in a borehole drilled into the bedrock strata at that location. Due to natural geological variability and data availability, this map cannot and is not intended to represent actual conditions on a site specific scale. For site specific investigations more detailed geological and hydrogeological information is available from GSNI. A more detailed description of the aquifer classification methodology can be found in McConvey P J 2005. Water Framework Directive, An aquifer classification scheme for Northern Ireland, Geological Survey of Northern Ireland, Belfast. Commissioned Report pdf document. Advice on groundwater management and protection matters is available from the GSNI hydrogeologist or by contacting the Groundwater Team at NIEA. Further information on the hydrogeology of Northern Ireland is available in Hydrogeology of Northern Ireland, Robins N S (1997) and Hydrogeological Map of Northern Ireland, BGS 1994 both available from the BGS bookshop or from the GSNI office (note: the aquifer classification used on the 1994 hydrogeological published map differs from the classification shown on the GeoIndex layer). NOTE: When considering the distribution of aquifers within a certain area, reference should also be made to the superficials aquifer layer, available on this website.
-
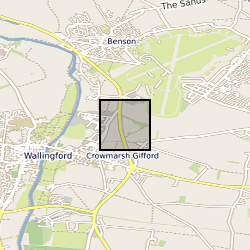
The borehole is located at the UK Centre for Ecology and Hydrology (UKCEH), screened between 2 and 4.5 m in the Thames gravels, and drilled to a total depth of 4.8m. It is located on an actively managed grass verge with popular and sycamore trees within 10 m. The stilling well is positioned 420 m west of the borehole in the River Thames. Both stage and groundwater level were monitored at 1-minutre frequency to investigate hydrological fractal scaling of high frequency data between 2012 and 2016. An automatic weather station is present between the borehole and stilling well and the data are available separately from UKCEH (stetur@ceh.ac.uk). Further site description is provided in: Habib, A. et al. 2017. Journal of Hydrology, 549, 715-730. Habib, A. et al. 2022. Hydrological Sciences Journal
-

Inventory of wells, water quality data, water levels, abstraction rates for Jersey.